
Logging
Logs are essential for analysing the traffic and debugging requests when an issue occurs. The MuleSoft Json Logger is an excellent addition to our mule applications and can be used to format Mule logs.
In Mule applications, we want different types of logs to trace requests and debug issues. We also need business logs to connect to external systems where we can create dashboards to analyse the logs in more detail.
There are different types of logs as below.
Application Logs
These log the events that trace a message through a Mule application, e.g. Request received, Response returned, Flow entry, Flow exit etc. They’re logged at the INFO level, where it’s generally advised not to log payloads. This is because logging specific data can cause security concerns (PII, Confidential, Sensitive data being written to logs). This can also lead to cluttered log files, making it challenging to review logs.
Debug Logs
These logs are useful to debug any issues in our Mule application. A developer can use these logs to log any specific data which can be useful to investigate an issue, including the payload. For example, ID for a record being processed, specific error messages, no records returned, request responses to a service, etc. These would be logged at the DEBUG level. DEBUG logs could then be enabled in Dev & Test environments to allow developers to troubleshoot issues but disabled in Production until/unless an issue occurs where they are required.
Business Logs
These logs are sent to external systems (Splunk, ELK) to create different dashboards and visualisations of activity using these logs.
Externalising logs
Sometimes we need to send our mule logs to external systems like Splunk, ELK etc., to create dashboards and analyse data more extensively.
The Json Logger connector provides a way to achieve this. Below is the architecture to send Json logs to external systems.
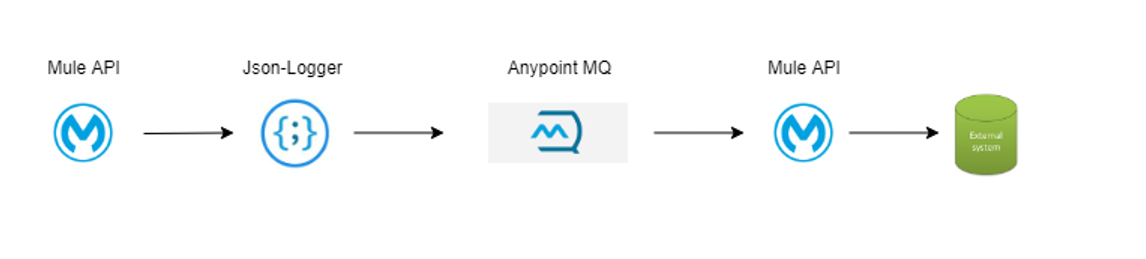
We see this in a detailed manner in the below explanation.
Note: We can externalise logs using log4j appenders too but using the message queue system has a few advantages as listed below
- We can spike control traffic to external systems with simple configurations.
- We can send the same message to multiple systems using the Publish/Subscribe model.
- Message delivery can be guaranteed by using DLQs.
Add Json Logger connector to a Mule API
Add configurations for each type of log in global.xml as shown below
Note: Only business_logs are sent to external systems
- Application Logs

- Debug Logs
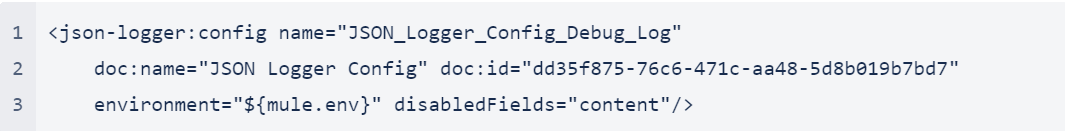
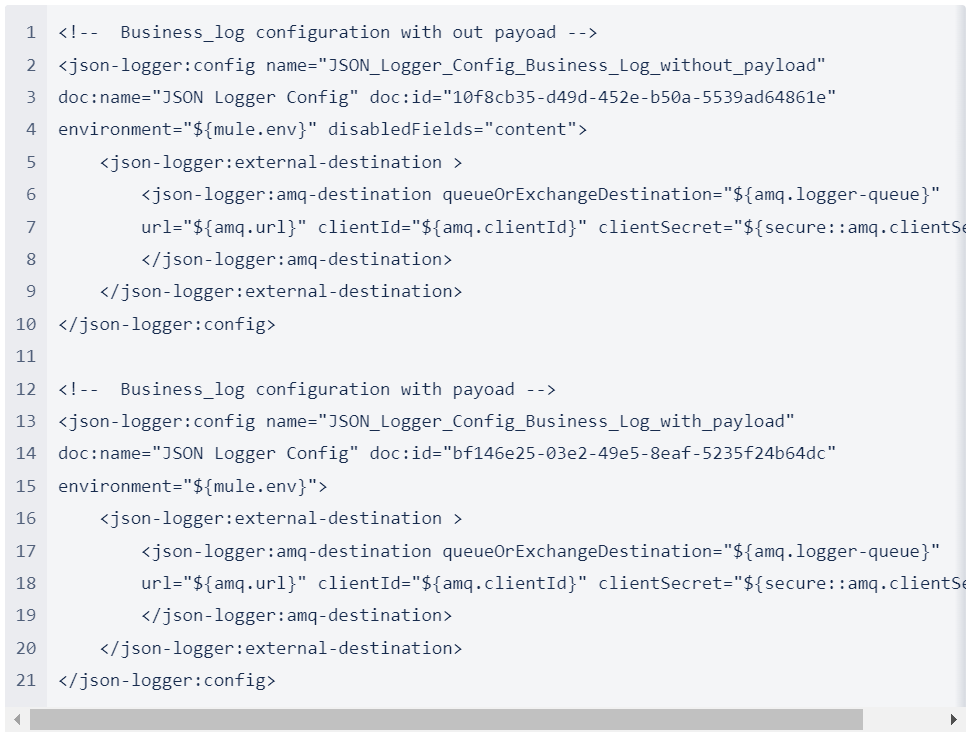
- Business Logs
This will have two configurations: one that includes a payload in the log and one that doesn’t.
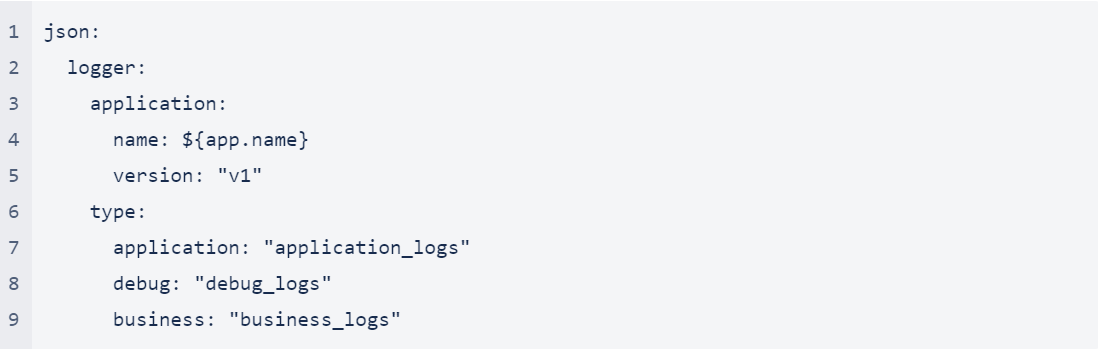
- Add below properties in common-properties.yaml
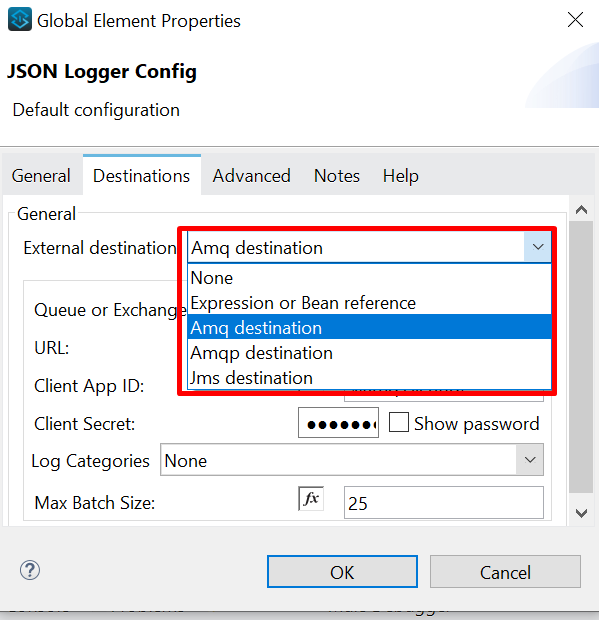
- Create Anypoint Exchange/Queues and configure as shown below.
Note: In this example, We are using Anypoint MQ as an external destination, but the Json logger provides options to configure different external destinations, as shown below. We can use any JMS or other destinations as per our requirements and convenience.
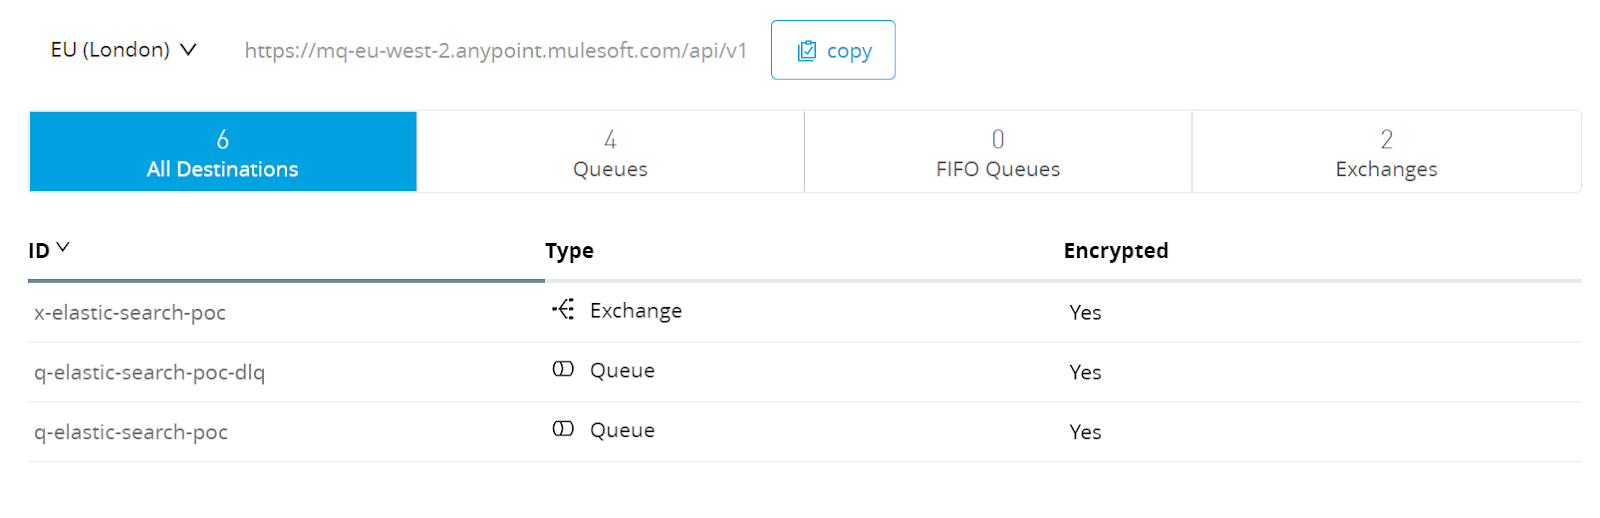
Create Exchanges/Queues
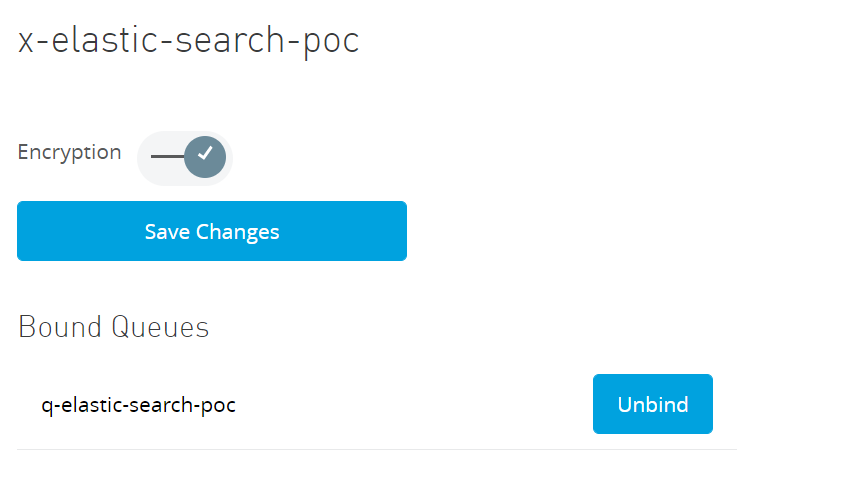
Bind queue to the exchange
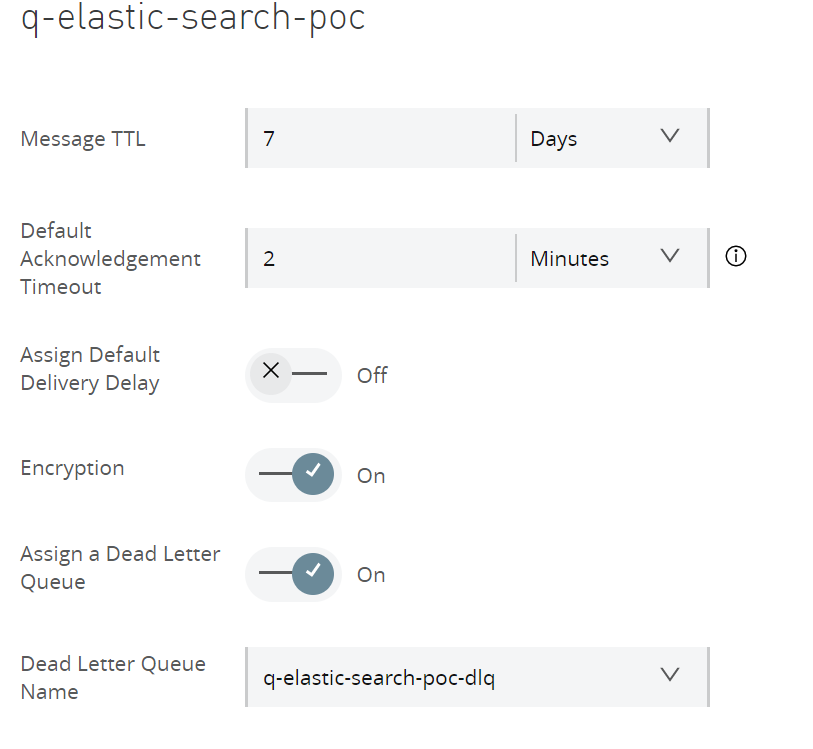
Assign the dead-letter queue to the main queue
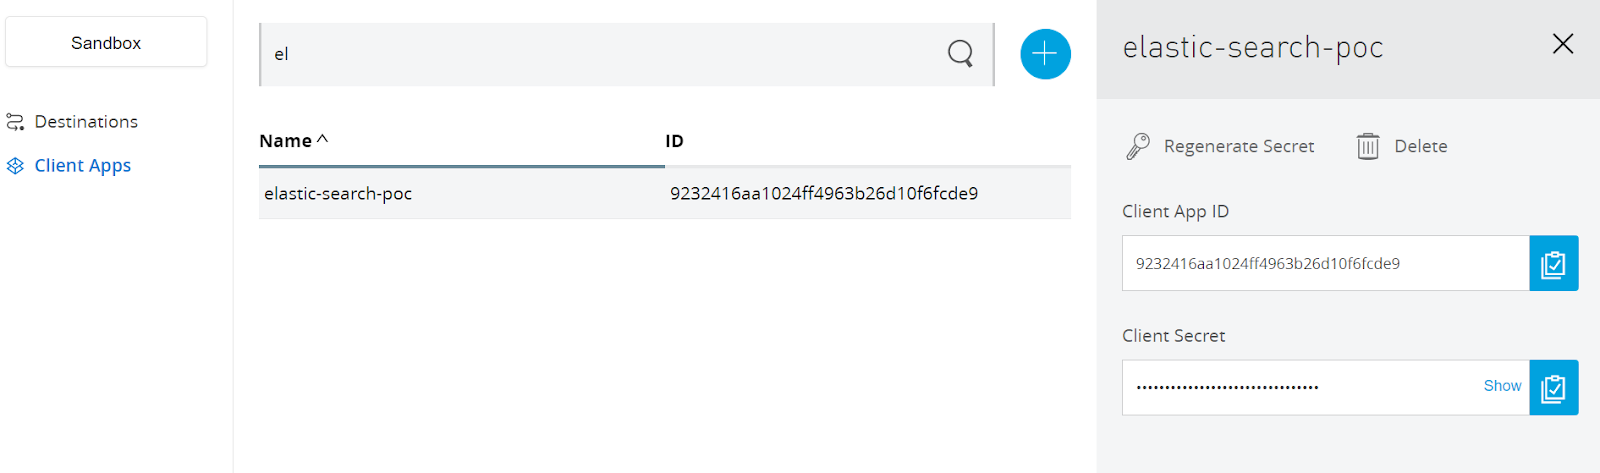
Create a client app to use in mule application to access Anypoint MQ
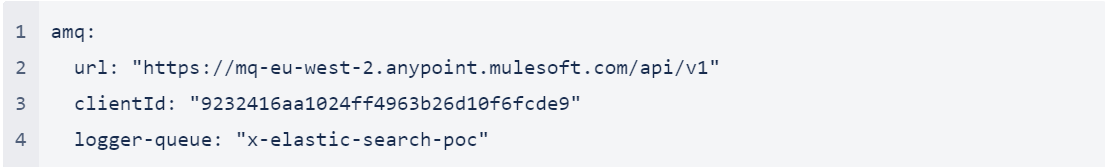
- Add these exchange/queue details in the properties file as shown below.
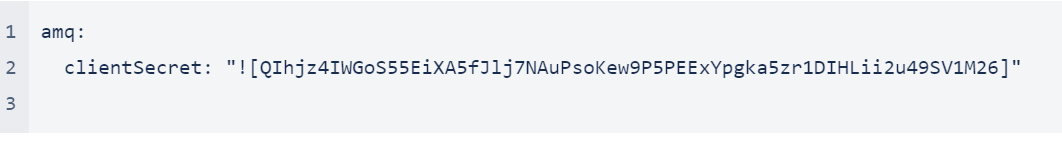
Secure properties file
- Now, we need to drag the Json Logger connector and add different logs as required.
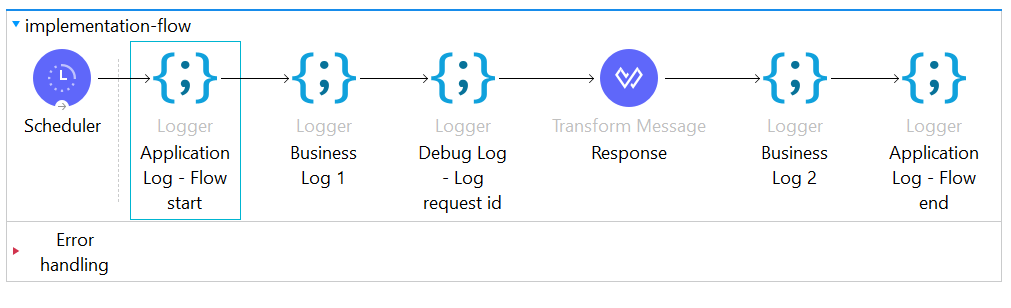
- Below are the configurations for each type of logs
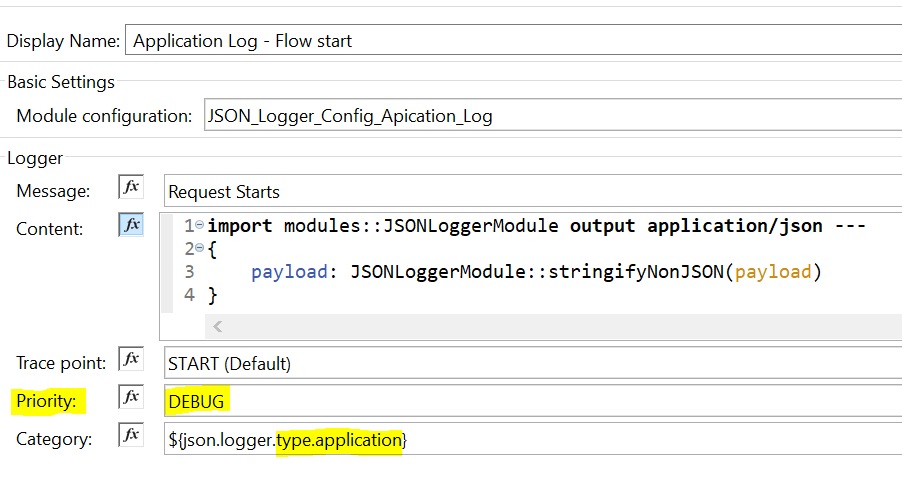
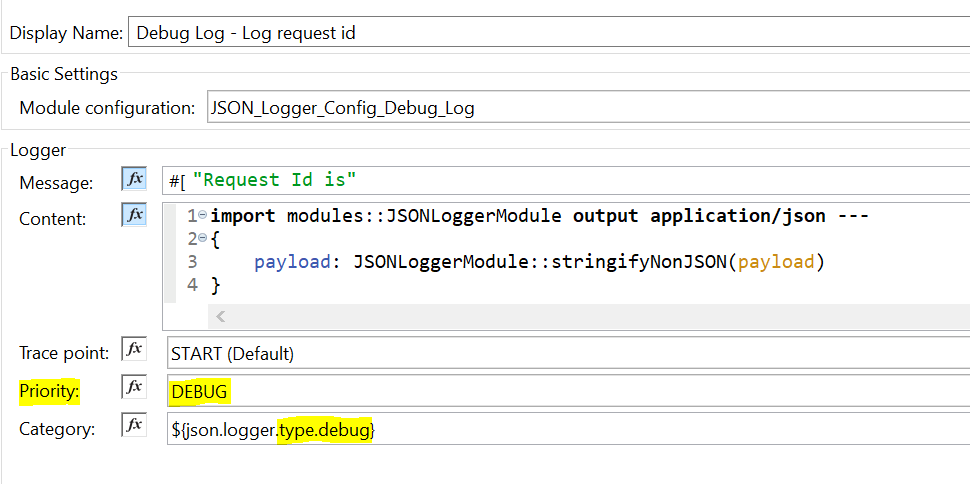
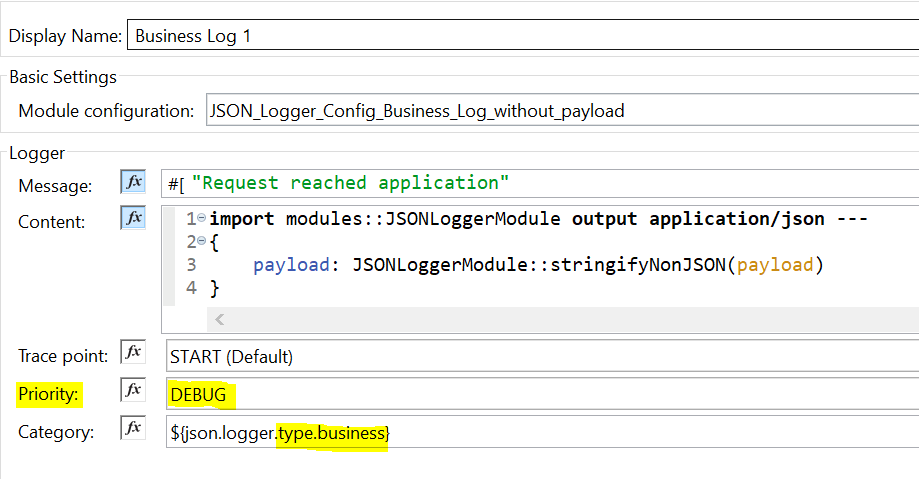
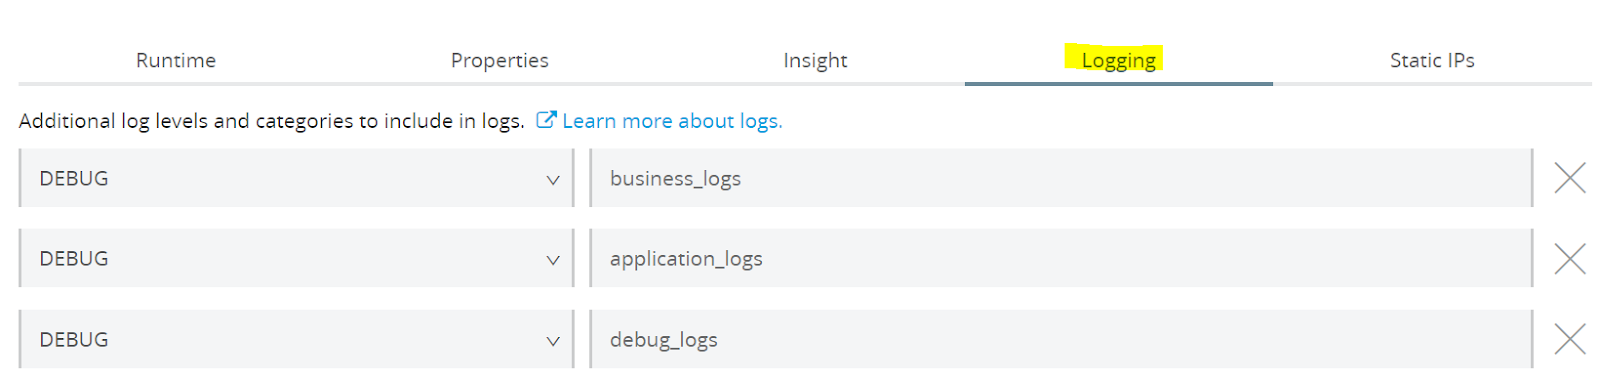
- For the three types of logs, ‘Priority’ is set to DEBUG. This is an important configuration to disable logs. We might not want all logs enabled in all environments. We can enable/disable specific log types on demand using a simple configuration on the cloud hub.
- With the above configuration, All the business_logs will be published to the configured queue. Below is an example format of the message
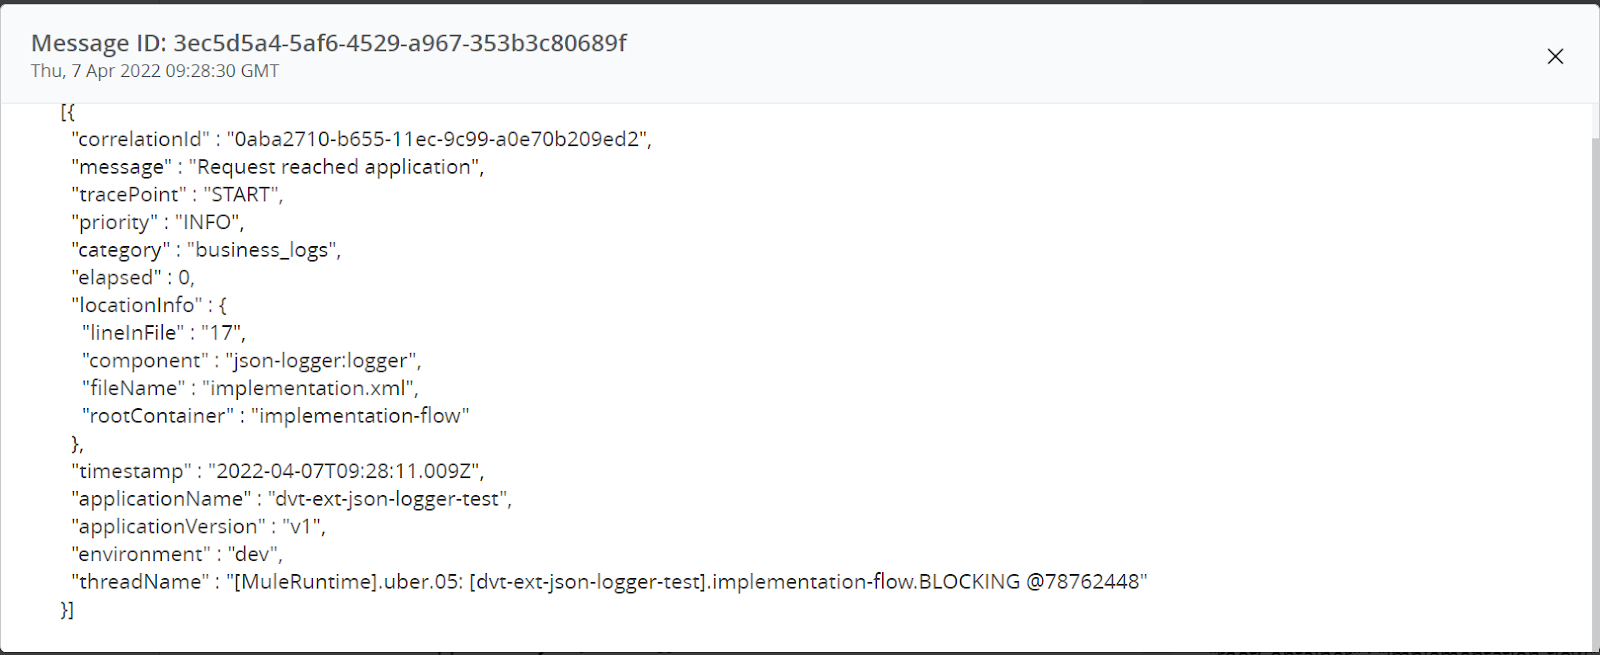
- Now, Create a common mule application which consumes messages from the queue and publishes it to external systems. In the below example the external system is the elastic search.
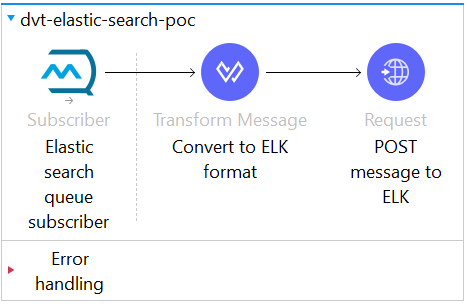
- That’s it! Now, we should be able to see these messages in the elastic stack and should be able to create different dashboards as required.
- There are a few other beneficial configurations available in json logger, which we can use to mask the sensitive data, parse payloads etc. We can explore these options going forward.
Summary
We segregated our mule logs into three different types: application_logs, debug_logs and business_logs. We saw how we can enable and disable specific types of logs on demand and how we can send specific types of logs to external systems using external destination configuration.

