
Introduction
Software applications are the backbone of many businesses and organisations. They provide many critical services and are generally the primary channel for interaction with customers and users. Therefore, ensuring optimal performance is essential to maintaining these relationships and retaining customers.
However, poorly performing applications can wreak havoc on an organisation’s ability to operate effectively. Here is where Application Performance Monitoring (APM) tools come into play. In this article, we’ll take a closer look at APM tools and their importance. We’ll also examine how they can be applied to MuleSoft’s Runtimes and their APIs.
The Importance of APM Tools
Suppose you’re running an e-commerce website, and during a major sales event, your site experiences slow load times, lost transactions, and frequent errors. This all results in frustrated customers, many eventually abandoning their Shopping Carts. Ultimately, you begin to lose valuable revenue – not a desirable situation.
As the name suggests, APM tools have the specific purpose of monitoring software applications. They provide real-time insights into network traffic and overall performance. They offer a comprehensive view, allowing you to detect issues immediately and, if not directly fix them, provide the information to analyse the situation thoroughly.
Here are some key reasons why APM tools are essential:
- Proactive Issue Detection – APM tools help to quickly identify performance bottlenecks and anomalies, enabling proactive issue resolution. It minimises downtime and improves user experience.
- Optimisation Possibilities – With detailed performance data, software engineers can locate areas that need optimisation. This data-driven approach ensures that efforts focus on hotspots having the most significant impact.
- Resource Efficiency – These tools provide insights into resource utilisation, helping organisations make informed decisions about scaling up or down. All are based on actual demand and, ultimately, help reduce infrastructure costs.
- Root Cause Analysis – When issues occur, APM tools assist in root cause analysis, reducing the time it takes to diagnose and fix problems. It minimises the impact on users and critical business operations.
Many APM tools are currently available, each with its features and capabilities. Some of the most popular are Dynatrace, New Relic, AppDynamics and Datadog. MuleSoft even provides a level of APM tooling built directly into its iPaaS – called Anypoint Monitoring. However, in the remainder of this article, we’ll concentrate on one of the external tools, Dynatrace and how to use it to monitor MuleSoft.
Dynatrace Basics
Before going any further, let’s have an overview of the relevant components of Dynatrace and how to set it up for monitoring.
Dynatrace Application
This is the Dynatrace software that processes collected metrics and allows access to the UI and other analysis tools. It can be installed either On-Premise (termed as a Managed Deployment) or is provided through a PaaS solution (called Dynatrace SaaS).
This application provides a substantial set of analysis tools, dashboards displaying metrics in real-time, the ability to view logs, perform code vulnerability checking and conduct transaction tracing.
OneAgents
OneAgents are the actual software agents that monitor host systems (i.e. the computer, the OS, the VM). They are a set of specialised tools, all contained within one binary installation file, that must be installed on the actual host being monitored. Once running, they collect various metrics (CPU usage, IO operations, network traffic, etc.).
These agents can also inject themselves into running processes to provide greater performance insight – even down to the code level.
ActiveGates
The OneAgents themselves do not directly communicate with the Dynatrace application. An ActiveGate is required, which acts as a secure proxy. Again, it is a single installation component, either directly on the host to be monitored or on another host accessible via the network. They then route data collected by the agent to the Dynatrace application.
ActiveGates are multi-purpose and can also perform some monitoring activities. They can access and query APIs from various technologies to collect exposed performance data.
Extensions
As the name suggests, Extensions are a way of extending the core functionality of Dynatrace. They can monitor technology that isn’t generally internally accessible from external software tools.
For example, many PaaS providers do not allow third-party software to be installed on their platform, which renders any APM tool impotent. However, many of these platforms do provide some external access via APIs. Extensions are packaged solutions, often based around these platform APIs, to take advantage of this limited external access.
Wherever a OneAgent can’t be installed directly on a host, an Extension may be a suitable alternative.
It has to be pointed out here that Extensions, similar to OneAgents, can only communicate with the Dynatrace application via an ActiveGate. Therefore, an ActiveGate must be installed somewhere to make this communication channel possible. It may seem counter-intuitive and adds an extra network hop, but this is Dynatrace’s architecture. However, if you are already using Dynatrace, you should be able to re-use an already installed ActiveGate to achieve this without needing a new installation.
There are two MuleSoft-related Extensions, CloudHub monitoring and AnypointMQ monitoring.
Monitoring MuleSoft
Let’s look at some options to use Dynatrace to monitor MuleSoft Runtimes, whether deployed in CloudHub or on-premise, standalone Runtimes.
MuleSoft provides an integration platform that connects services and applications, thus providing greater business functionality. It’s done using a specialised Runtime running within a Java Virtual Machine. The Runtime allows discrete but interconnected APIs to be operated. These Runtimes can be run in CloudHub (a component of a broader iPaaS solution called Anypoint Platform) or deployed and run on-premise.
Below are two high-level overviews for using the Dynatrace SaaS platform to monitor either type of Runtime.
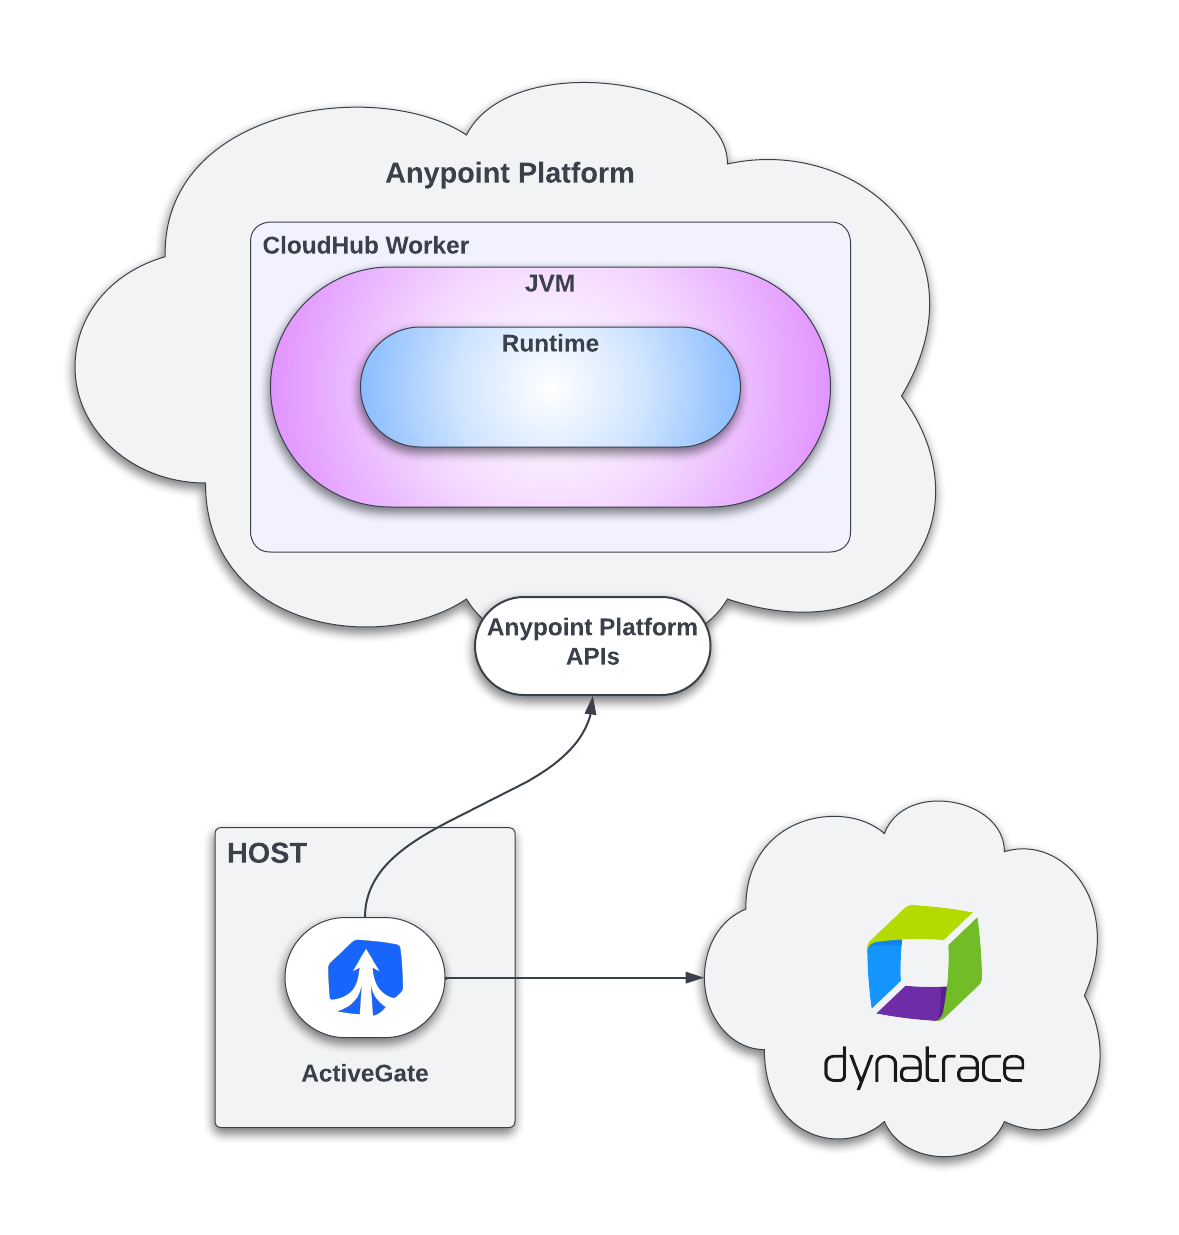
CloudHub
As with many other PaaS solutions, MuleSoft does not allow additional, non-MuleSoft software to be installed onto any SaaS-based Runtimes. However, several platform-related APIs can access many metrics, giving an overview of performance and utilisation. For this purpose, Dynatrace has provided an Extension to collect and present these metrics on a pre-built dashboard.
It must be noted here that the information provided by this Extension is only comparable to those dashboards already supplied within Anypoint Platform. It can offer limited new insights above what the platform already provides. This then leads to the question as to whether you need Dynatrace at all. However, if the aim is for Dynatrace to be the primary monitoring tool within an organisation (i.e. the single source of information for all applications). In that case, this Extension allows for precisely that.
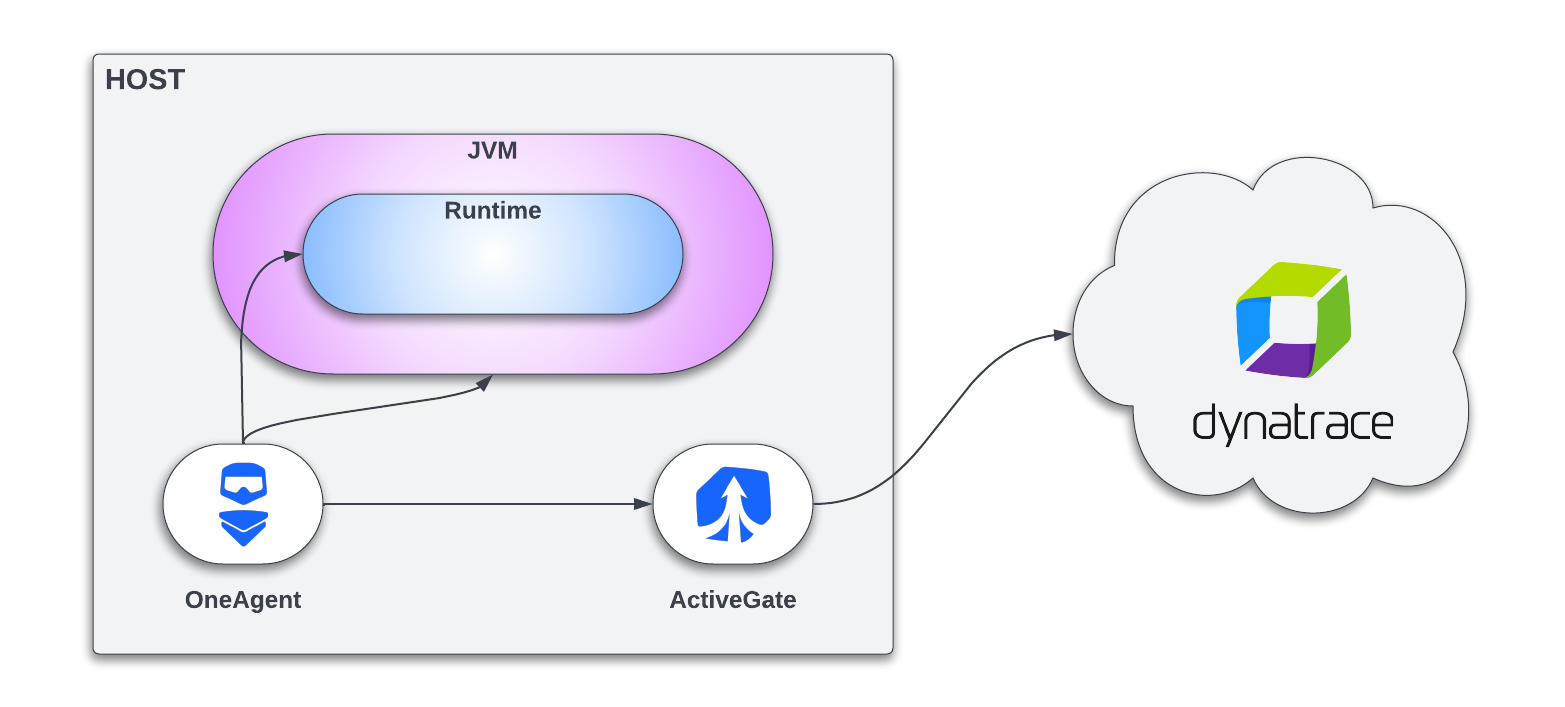
On-Premise
When wanting to monitor an On-Premise Runtime, a OneAgent must be installed on the host running that Runtime. Note an ActiveGate is also required to route communication to the Dynatrace application.
Once the agent has been installed, it will monitor all host software: the JVM running the MuleSoft Runtime and everything else (the complete OS and all other applications). The amount of information can be overwhelming, but it does allow for the use of additional analysis tools provided by Dynatrace. As an example, I particularly like Distributed Tracing, which enables you to follow the route of any particular transaction through the Runtime and elsewhere.
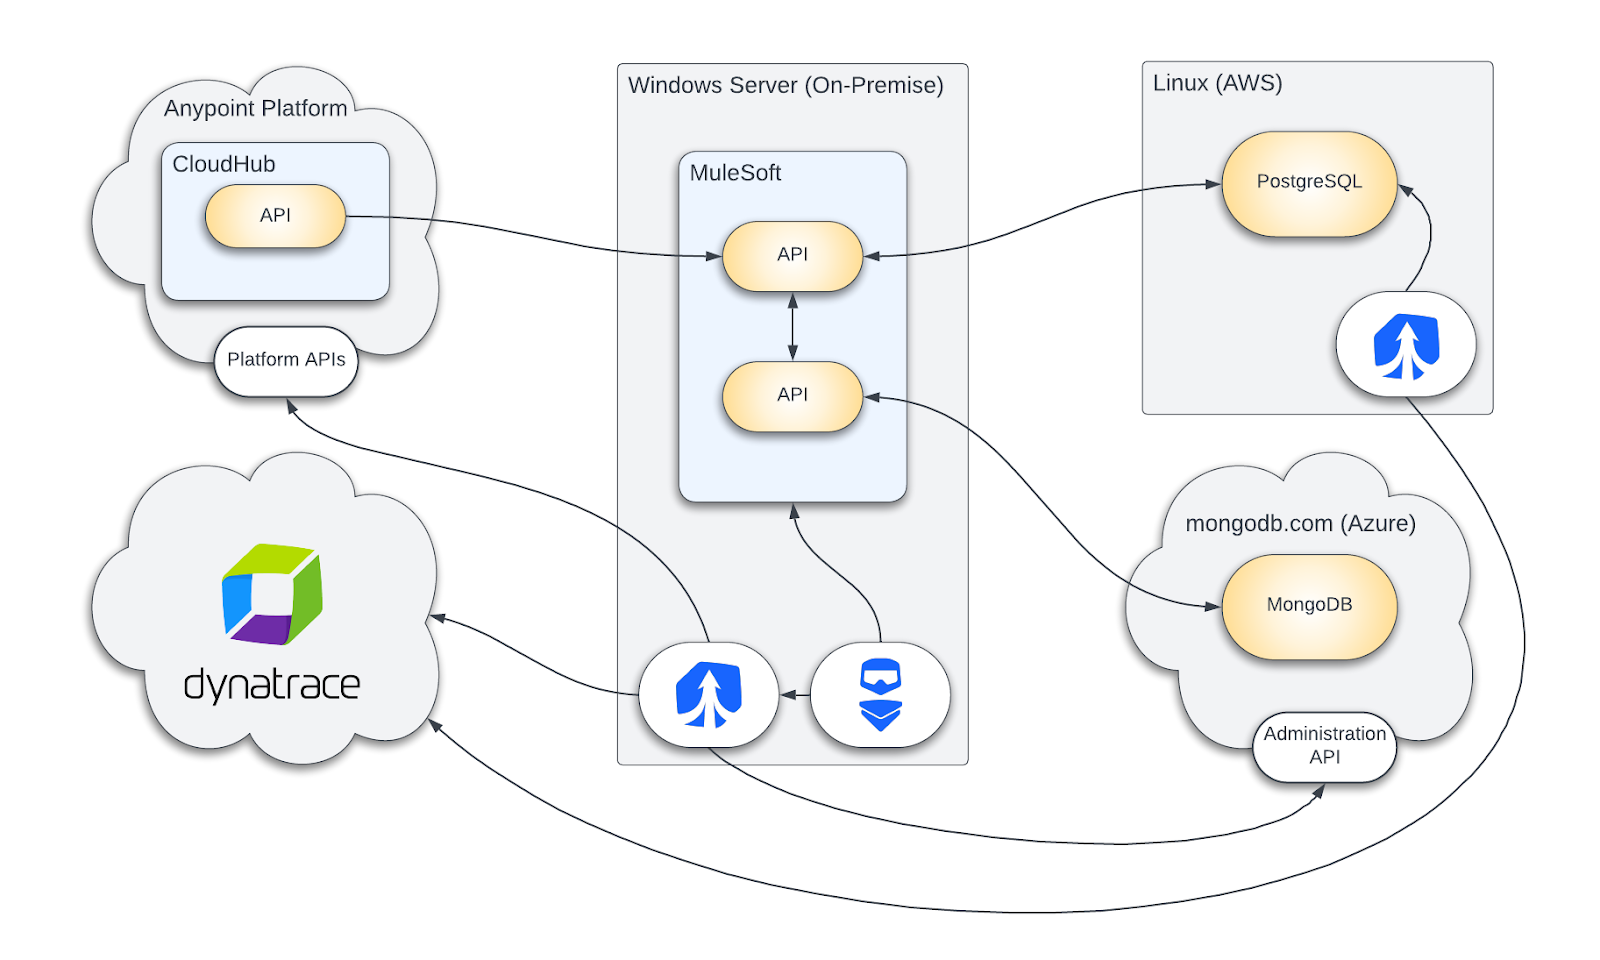
Aggregated Example
Dynatrace is competent in monitoring multiple technologies and different platforms all at once. The diagram below is a stylised example included to illustrate this. Both Anypoint Platform and an On-Premise Runtime are connected to other SaaS and PaaS solutions. Dynatrace has been used to monitor all components employing OneAgents and ActiveGates as appropriate.
Conclusion
The need to deliver a high-performing user and customer experience in today’s digital world is non-negotiable. APM tools give organisations the ability to achieve this by providing real-time insights. It allows for proactive monitoring of an estate and an instantaneous overview of its health and performance.
The choice of APM tool does, however, depend on an organisation’s specific needs and budget. Nonetheless, integrating APM into software development and operations is a wise investment. It helps maintain customer satisfaction, reduce downtime, and increase business growth.
If you want to learn more about this, you can get in touch here.

